Errors are common when we write the code and these errors can be logical or syntax. To identify these errors, we need Debuggers that can go through the entire code or program, identify the errors and also fix them. The process is known as debugging.
-
Debugger
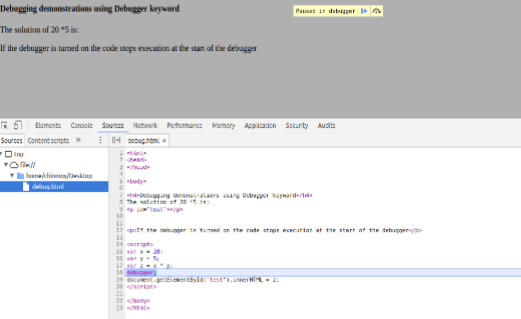
The debugger keyword is used in the code to forcefully stop the execution of the code at a breaking point and calls the debugging function. When debugging is required then the Debugger function is executed else no action is performed.
<h4>Debugging example using Debugger keyword</h4>

The solution of 20 * 5 is:

<p id="test"></p>

<p>If the debugger is turned on the code stops

execution at the start of the debugger</p>

var x = 20;

var y = 5;

var z = x * y;

debugger; //execution stops at this line

document.getElementById("test").innerHTML = z;
This all can be achieved through the “Console” of the debugger menu.
-
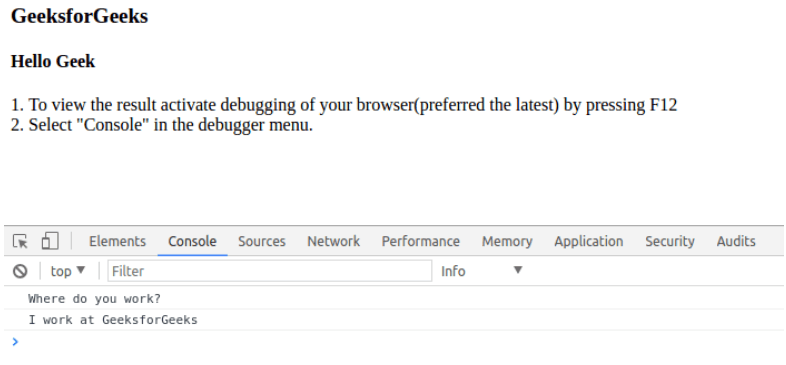
The use of console.log Method
There is another way in which the JavaScript values can be displayed in the debugger window.
<h3>New</h3>

<h4>Example</h4>

<p>

1. To view the result activate debugging of your

browser(preferred the latest) by pressing F12 <br>

2. Select "Console" in the debugger menu.

</p>

x = "Where do you work?"

y = "I work at GeeksforGeeks"

console.log(x);

console.log(y);
-
Setting Breakpoints
The console.log() is a good way to find errors in the code but the breakpoint method is a faster, efficient, and better method. In this method, Breakpoints stops the execution of code at that point where the breakpoint is set, so that the values of variables can be examined at that time.
Here are some pros of using the Breakpoints Method over console.log() method:
In the console.log() method the user has to understand the code and manually put console.log() at points in the code. But in the breakpoints method, we can set breakpoints through the Developers tool anywhere in code without even knowing it.
In the console.log() method we have to manually print values of different variables but at a certain breakpoint, all the values of all variables are displayed automatically in the Developers tool.
Enter the Developers tool section by pressing the F12 key and go-to sources.
In the source section, select a JavaScript file and set breakpoints by either selecting from the provided list like DOM breakpoints or Event listener breakpoints which stops the execution of code whenever an event occurs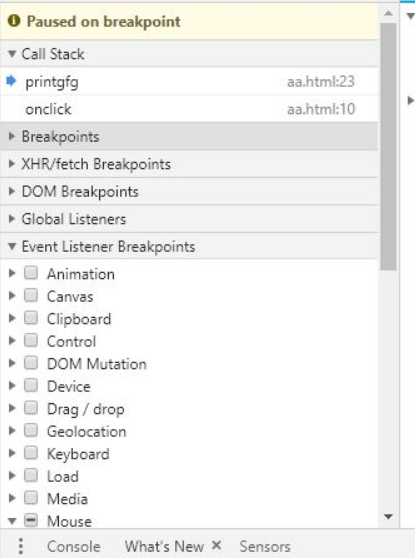
OR set a breakpoint by simply clicking the line number shown in the code. In the below image, a breakpoint is set at line 23. (The code used is the same as the above example)
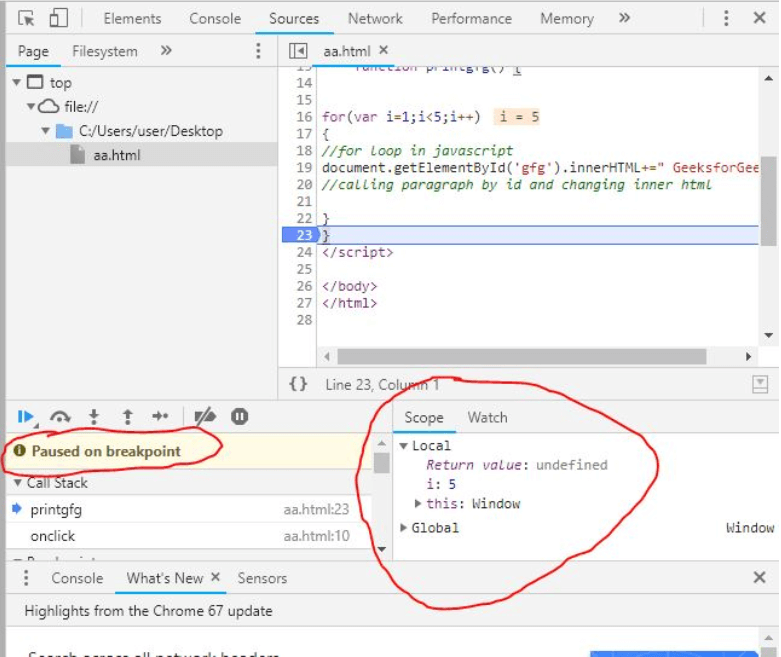
As shown in the image, the code stopped at line 23 and showed all the values of variables in the code at that point in time.
As we can see the value of i was initially 1 and at the breakpoint, it is 5 now. Hence, GeeksForGeeks was printed 5-1=4 times.
StudySection provides a Windows 10 certification exam to help those with skills in Microsoft Windows 10 operating system. This exam is available for two different levels namely “Foundation” and “Advanced”. This Windows 10 Certification can help you land in a good job position when attached to your resume.


